2.2 Libraries and Clients
Each program that you have written consists of Java code that resides in a single .java file. For large programs, keeping all the code in a single file is restrictive and unnecessary. Fortunately, it is very easy in Java to refer to a method in one file that is defined in another. This ability has two important consequences on our style of programming:
- It allows us to extend the Java language by developing libraries of static methods for use by any other program, keeping each library in its own file.
- It enables modular programming, where we divide a program up into static methods, grouped together in some logical way according to the dictates of the application. Modular programming is important because it allows us to independently develop, debug, and even compile parts of big program one piece at a time, leaving each finished piece in its own file for use without having to worry about its details again.
Using static methods in other programs.
To refer to a static method in one class that is defined in another: Keep both classes in the same directory in your computer. To call a method, prepend its class name and a period separator. For example, SATmyYear.java calls the Phi() method in Gaussian.java, which calls the sqrt() method in Newton.java.We describe several details about the process.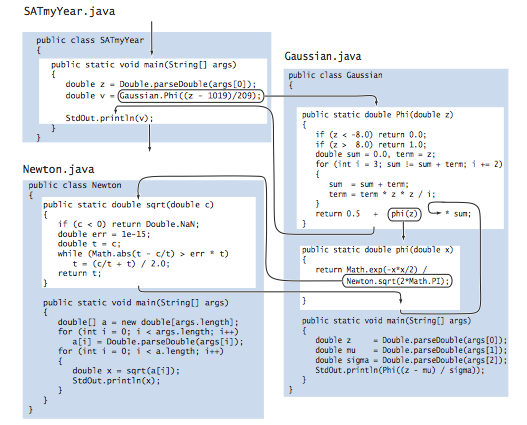
- The public keyword. The public modifier identifies the method as available for use by any other program with access to the file. You can also identify methods as private (and there are a few other categories) but you have no reason to do so at this point.
- The .class file. It is natural to use the term program to refer to all the code that we keep in a single file, and we use the term modular program to refer to a set of files that refer to methods in one another. In Java, by convention, each program is a Java class (kept in a .java file with the same name of the class). For now, each class is merely a set of static methods (one of which is main()). When you compile the program (by typing javac followed by the class name), the Java compiler makes a file with the class name followed by a .class extension that has the code of your program in a language more suited to your computer.
- Compile when necessary. When you compile a program, the Java compiler will compile everything that needs to be compiled in order to run that program. If you were to be using Newton.sqrt() in Gaussian, when you type javac Gaussian.java, Java would also check whether you modified Newton.java since the last time it was compiled (by checking the time it was last changed against the time Newton.class was created). If so, it would also compile Newton.
- Multiple main methods. SATmyYear, Newton, and Gaussian each have main() methods. When you type java followed by a class name, Java transfers control to the machine code corresponding to the main() static method defined in that class.
Libraries.
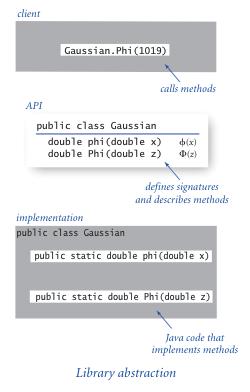
We refer to a class that comprises methods for use by other programs as a library.- Clients. We use the term client to refer to the program that calls a given method. When a class contains a method that is a client of a method in another class, we say that the first class is a client of the second class.
- APIs. Programmers normally think in terms of a contract between the client and the implementation that is a clear specification of what the method is to do.
- Implementations. We use the term implementation to describe the Java code that implements the methods in an API.
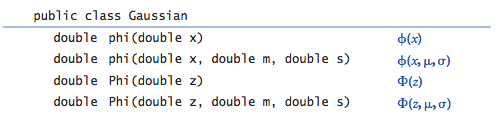
This same mechanism is effective for user-defined libraries. The API allows any client to use the library without having to examine the code in the implementation. The guiding principle in API design is to provide to clients the methods they need and no others. For example, Gaussian.java is an implementation of the following API:
Random numbers.
StdRandom.java is a library for generating random numbers from various distributions.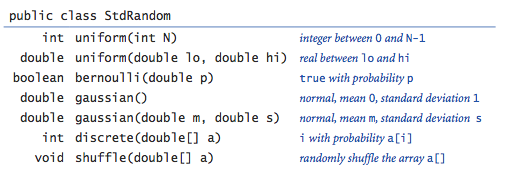
- API design. Each of the methods in StdRandom make certain assumptions about the values of their arguments. For example, we assume that clients will call uniform(N) only for positive integers N and bernoulli(p) only for p between 0 and 1. All of these assumptions are part of the contract between the client and the implementation.
- Unit testing.
Even though we implement StdRandom without reference
to any particular client, it is good programming practice to include a test
method main() that, while not used when a client class uses the library,
is helpful for use when debugging and testing the methods in the library.
Whenever you create a library, you should include a main() method for unit
testing and debugging. Proper unit testing can be a significant programming
challenge in itself, but, at a minimum, you
should always include a main() method that
- exercises all the code
- provides some assurance that the code is working
- takes a parameter from the command line to allow more testing and then refine that main() to do more exhaustive testing as you use the library more extensively.
- Stress testing. An extensively used library such as this one should also be subject to stress testing, where we make sure that it does not crash when the client breaks some assumption in the contract or makes some assumption that is not explicitly covered. What should discrete() do if array entries do not sum to exactly 1? Such cases are sometimes referred to as corner cases.
Input and output for arrays.
It is useful to build a library of static methods for reading arrays of primitive types from standard input and printing them to standard output, as expressed in this API: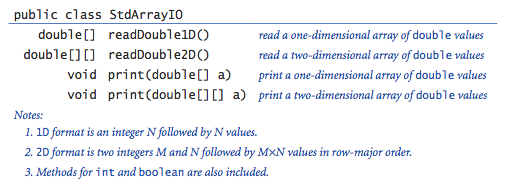
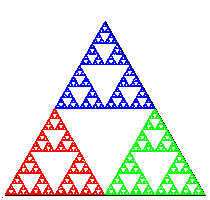
Iterated function systems.
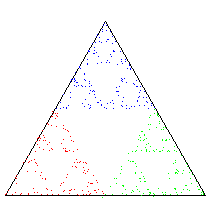
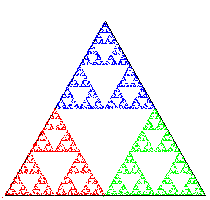
An Iterated function system (IFS) is a general way to produce fractals like the Sierpinski triangle and the Barnsley Fern. As a first example, consider the following simple process: Start by plotting a point at one of the vertices of an equilateral triangle. Then pick one of the three vertices at random and plot a new point halfway between the point just plotted and that vertex. Continue performing the same operation.Sierpinski.java simulates this process. Below are snapshots after 1,000, 10,000, and 100,000 steps. You might recognize the figure as the Sierpinski triangle.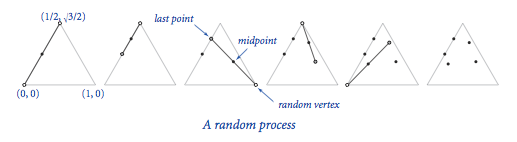
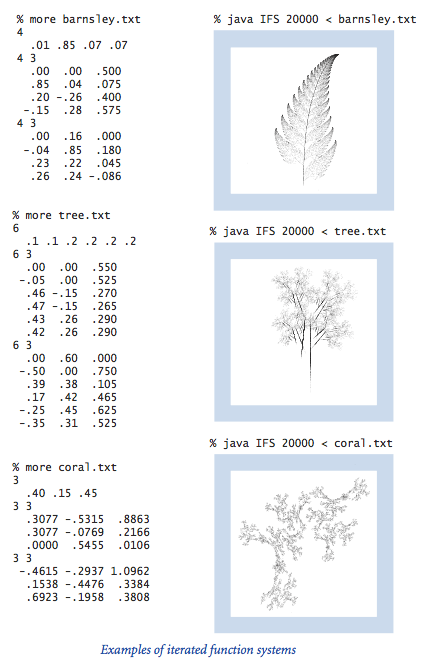
IFS.java is a data-driven version program that simulates a generalization of this process.
You can run it on the inputs sierpinski.txt or fern.txt or tree.txt.
Standard statistics.
StdStats.java is a library for statistical calculations and basic visualizations, as articulated in the following API. See the textbook for details.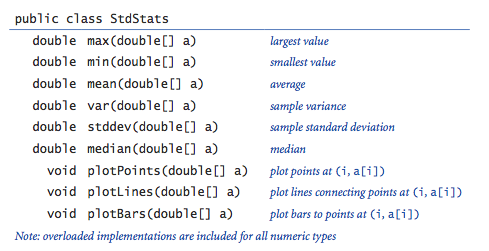
Bernoulli trials.
Program Bernoulli.java counts the number of heads found when a fair coin is flipped N times and compares the result with the predicted Gaussian distribution function. According to the Central Limit Theorem, the resulting histogram is extremely well approximated by the Gaussian distribution with mean N/2 and variance N/4. Below are sample outputs when N = 16, 32, and 64.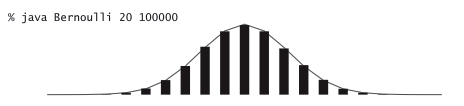
Modular programming.
The library implementations that we have developed illustrate a programming style known as modular programming. Instead of writing a new program that is self-contained in its own file to address a new problem, we break up each task into smaller, more manageable subtasks, then implement and independently debug code that addresses each subtask. IFS.java and Bernoulli.java exemplify modular programming because they are relatively sophisticated computations that are implemented with several relatively small modules.We emphasize modular programming throughout this book because it has many important advantages, including the following: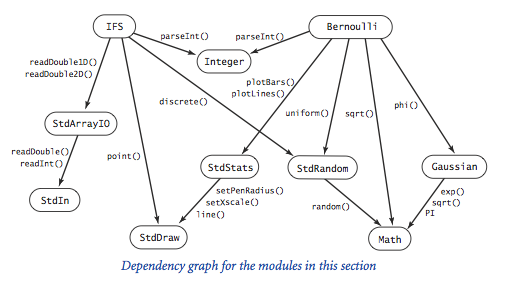
- Programs of a reasonable size. No large task is so complex that it cannot be divided into smaller subtasks.
- Debugging. With modular programming and our guiding principle of keeping the scope of variables local to the extent possible, we severely restrict the number of possibilities that we have to consider when debugging. Equally important is the idea of a contract between client and implementation. Once we are satisfied that an implementation is meeting its end of the bargain, we can debug all its clients under that assumption.
- Code reuse. Once we have implemented libraries such as StdStats and StdRandom, we do not have to worry about writing code to compute averages or standard deviations or to generate random numbers again—we can simply reuse the code that we have written.
- Maintenance. Like a good piece of writing, a good program can always be improved. Supppose that while developing a new client, you find a bug in some module. With modular programming, fixing that bug amounts to fixing bugs in all of the module's clients.
Q + A
Q. I tried to use StdRandom, but get the following error message. What's wrong?
A. You need to download StdRandom.java into the directory containing your client, or use your operating system's classpath mechanism.
Q. Is there a keyword that identifies a class as a library?
A. No, any set of public methods will do. There is a bit of a conceptual leap in this viewpoint, because it is one thing to sit down to create a .java file that you will compile and run (perhaps run again sometime later with different data), quite another thing to create a .java file that you will rely on much later in the future, and still another thing to create a .java file for someone else to use in the future. You need to develop some libraries for your own use before engaging in this sort of activity, which is the province of experienced systems programmers.
Q. How do I develop a new version of a library that I have been using for a while?
A. With care. Any change to the API might break any client program, so it is best to work in a separate directory. But then you are working with a copy of the code. If you are changing a library that has a lot of clients, you can appreciate the problems faced by companies putting out new versions of their software. If you just want to add a few methods to a library, go ahead: that is usually not too dangerous.
Q. How do I know that an implementation behaves properly? Why not automatically check that it satisfies the API?
A. We use informal specifications because writing a detailed specification is not much different than writing a program. Moreover, a fundamental tenet of theoretical computer science says that doing so does not even solve the basic problem because there is no way in general to check that two different programs perform the same computation.
Exercises
- Add to Gaussian.java an overloaded method implementation phi(x, mu, sigma) that computes the Gaussian distribution with a given mean μ and standard deviation σ, based on the formula φ(x, μ, σ) = φ((x - μ)/σ)/σ. Also include an overloaded implementation of the associated cumulative distribution function Phi(x, mu, sigma), based on the formula Φ(x, μ, σ) = Φ((x - μ)/σ).
- Write a static method library Hyperbolic.java that implements the hyperbolic trigonometric functions based on the definitions sinh(x) = (e^x - e^-x)/2 and cosh(x) = (x^x + e^-x)/2, with tanh(x), coth(x), sech(x), csch(x) defined in a manner analogous to standard trigonometric functions.
- Write a test client for both StdStats and StdRandom that checks that all of the methods in both libraries operate as expected. Take a command-line parameter N, generate N random numbers using each of the methods in StdRandom, and print out their statistics. Extra credit : Defend the results that you get by comparing them to those that are to be expected from mathematical analysis.
- Add to StdRandom.java a method shuffle() that takes an array of double values as argument and rearranges them in random order. Implement a test client that checks that each permutation of the array is produced about the same number of times.
- Develop a client that does stress testing for StdRandom. Pay particular attention to discrete(). For example, do the probabilities sum to 1?
- Develop a full implementation of StdArrayIO.java (implement all 12 methods indicated in the API).
- Write a method that takes double values ymin and ymax (with ymin strictly less than ymax) and a double array a[] as arguments and uses the StdStats library to linearly scale the values in a[] so that they are all between ymin and ymax.
- Write a Gaussian.java and StdStats.java client that explores the effects of changing the mean and standard deviation on the Gaussian distribution curve. Create one plot with curves having a fixed mean and various standard deviations and another with curves having a fixed standard deviation and various means.
- Add to StdRandom.java a static method maxwellBoltzmann() that returns a random value drawn from a Maxwell-Boltzmann distribution with parameter σ. To produce such a value, return the square root of the sum of the squares of three Gaussian random variables with mean 0 and standard deviation σ. The speeds of molecules in an ideal gas have a Maxwell-Boltzmann distribution.
- Modify Bernoulli.java to animate the bar graph, replotting it after each experiment, so that you can watch it converge to the normal distribution. Then add a command-line argument and an overloaded binomial() implementation to allow you to specify the probability p that a biased coin comes up heads, and run experiments to get a feeling for the distribution corresponding to a biased coin. Be sure to try values of p that are close to 0 and close to 1.
-
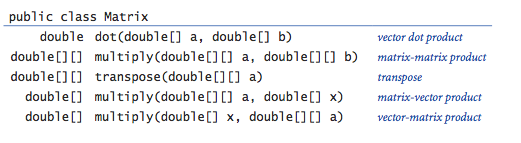
Write a library Matrix.java that implements
the following API.
- Write a Matrix.java client MarkovSquaring.java that implements the version of Markov.java described in Section 1.6 but is based on squaring the matrix, instead of iterating the vector-matrix multiplication.
- Rewrite RandomSurfer.java using the Write a StdArrayIO.java and StdRandom.java libraries.
- Add a method exp() to StdRandom.java that takes an argument λ and returns a random number from the exponential distribution with rate λ. Hint: If x is a random number uniformly distributed between 0 and 1, then -ln x / λ is a random number from the exponential distribution with rate λ.
Creative Exercises
- Sicherman dice.
Suppose that you have two six-sided dice, one
with faces labeled 1, 3, 4, 5, 6, and 8 and the other with faces labeled 1, 2,
2, 3, 3, and 4. Compare the probabilities of occurrence of each of the values
of the sum of the dice with those for a standard pair of dice.
Use StdRandom and StdStats.
Solution: dice with these properties are called Sicherman dice: they produce sums with the same frequency as regular dice (2 with probability 1/36, 3 with probability 2/36, and so on).
- Craps.
Here are the rules for a pass bet in the game of craps: Roll
two 6-sided dice, and let x be their sum.
- If x is 7 or 11, you win.
- If x is 2, 3, or 12, you lose.
- If their sum is x, you win.
- If their sum is 7, you lose.
- Dynamic histogram. Suppose that the standard input stream is a sequence of double values. Write a program that takes an integer N and two double values l and r from the command line and uses StdStats to plot a histogram of the count of the numbers in the standard input stream that fall in each of the N intervals defined by dividing (l , r) into N equal-sized intervals. Use your program to add code to your solution to exercise 2.2.3 to plot a histogram of the distribution of the numbers produced by each method, taking N from the command line.
- Tukey plot. A Tukey plot is a data visualization that generalizes a histogram, and is appropriate for use when each integer in a given range is associated with a set of y values. For each integer in the range, we compute the mean, standard deviation, 10th percentile, and 90th percentile of all the associated y values; draw a vertical line with x-coordinate i running from the 10th percentile y value to the 90th percentile y value; and then draw a thin rectangle centered on the line that runs from one standard deviation below the mean to one standard deviation above the mean. Suppose that the standard input stream is a sequence of pairs of numbers where the first number in each pair is an int and the second a double value. Write a StdStats and StdDraw client that takes an integer N from the command line and, assuming that all the int values on the input stream are between 0 and N-1, uses StdDraw to make a Tukey plot of the data.
- IFS. Experiment with various inputs to IFS.java to create patterns of your own design like the Sierpinksi triangle, Barnsley fern, or other examples in the table in the text. You mihgt begin b experimenting with minor modifications to the given inputs.
- IFS matrix implementation. Write a version of IFS.java that uses Matrix.multiply() (see Exercise 2.2.11) instead of the equations that compute the new values of x0 and y0.
- Stress test. Develop a client that does stress testing for StdStats.java. Work with a classmate, with one person writing code and the other testing it.
- Gamblers ruin. Develop a StdRandom.java client to study the gamblers ruin problem (see Program 1.3.8 and Exercises 1.3.21–24). Note: efining a static method for the experiment is more difficult than for Bernoulli.java because you cannot return two values.
- Library for properties of integers. Develop a library based on the functions that we have considered in this book for computing properties of integers. Include functions for determining whether a given integer is prime; whether two integers are relatively prime; computing all the factors of a given integer; the greatest common divisor and least common multiple of two integers; Eulers totient function (Exercise 2.1.26); and any other functions that you think might be useful. Include overloaded implementations for long values. Create an API, a client that performs stress testing, and clients that solve several of the exercises earlier in this book.
- Voting machines. Develop a StdRandom.java client (with appropriate static methods of its own) to study the following problem: Suppose that in a population of 100 million voters, 51% vote for candidate A and 49% vote for candidate B. However, the voting machines are prone to make mistakes, and 5% of the time they produce the wrong answer. Assuming the errors are made independently and at random, is a 5% error rate enough to invalidate the results of a close election? What error rate can be tolerated?
- Poker analysis. Write a StdRandom.java and StdStats.java client (with appropriate static methods of its own) to estimate the probabilities of getting one pair, two pair, three of a kind, a full house, and a flush in a five-card poker hand via simulation. Divide your program into appropriate static methods and defend your design decisions. Extra credit: Add straight and straight flush to the list of possibilities.
- Music library. Develop a library based on the functions in PlayThatTuneDeluxe.java that you can use to write client programs to create and manipulate songs.
- Animated plots. Write a program that takes a command-line argument M and produces a bar graph of the M most recent double values on standard input. Use the same animation technique that we used for BouncingBall.java: erase, redraw, show, and wait briefly. Each time your program reads a new number, it should redraw the whole graph. Since most of the picture does not change as it is redrawn slightly to the left, your program will produce the effect of a fixed-size window dynamically sliding over the input values. Use your program to plot a huge time-variant data file, such as stock prices.
- Array plot library. Develop your own plot methods that improve upon those in StdStats.java. Be creative! Try to make a plotting library that you think that you will use for some application in the future.
Web Exercises
- Sample standard deviation. The sample standard deviation of a sequence of N observations is defined similar to the standard deviation except that we divide by N-1 instead of N. Add a method sampleStddev() that computes this quantity.
- Barnsley fern.
Write a program Barnsley.java
that takes a command line argument N and plots a sequence of N points
according to the following rules. Set (x, y) = (0.5, 0). Then update
(x, y) to one of the following four quantities according to the probabilities
given.
PROBABILITY NEW X NEW Y 2% 0.5 0.27y 15% -0.139x + 0.263y + 0.57 0.246x + 0.224y - 0.036 13% 0.170x - 0.215y + 0.408 0.222x + 0.176y + 0.0893 70% 0.781x + 0.034y + 0.1075 -0.032x + 0.739y + 0.27
The pictures below show the results after 500, 1000, and 10,000 iterations.


- Black-Scholes. The Black-Scholes model predicts that the asset price at time t will be S' = S exp { (rt - 0.5*sigma^2*t + sigma ε sqrt(t) }, where epsilon is a standard Gaussian random variable. Can use Monte Carlo simulate to estimate. To estimate the value of the option at time T, compute max(S' - X, 0) and take mean over many trials of epsilon. The value of the option today is e^-rT * mean. European put = max(X - S', 0). Reuse function. Name your program BlackScholes.java. See Exercise 2.1.30 for an exact formula for this case.
- Simulation. Application: some kind of simulation which uses StdRandom and StdStats to flip coins and analyze mean/variance. [Ex: physics, financial based on Black-Scholes hedge simulation. Simulation needed to price options whose payoff depends on the price path, not just the price at the maturity time T. Ex: Asian average price call = max(0, S_bar - X) where S_bar is the average price of the asset from time 0 to T. Lookback option = max(0, S(T) - min_t S_t). Idea: discretize time into N periods.] another reference Break up simulation into various pieces encapsulated as functions.
- Flaming fractals. Implement a generalization of IFS to produce fractal flames like Water Lilies by Roger Johnston. Flaming fractals differ from classic IFS by using nonlinear update functions (sinusoidal, spherical, swirl, horseshoe), using a log-density display to color pixels according to how many times they result in the process, and incorporating color based on which rule was applied to get to that point.
- Random point on a sphere. Use StdRandom.gaussian() to generate a random point on the surface of a sphere or hypersphere using the following method: generate N random values from the gaussian distribution, x[0], ..., x[N-1]. Then (x[0]/scale, ..., x[N-1]/scale) is a random point on the N-dimensional sphere, where scale = sqrt(x[0]^2 + ... + x[N-1]^2).
- Coupon collector. Write a modular program CouponExperiment.java that runs experiments to estimate the value of the quantity of interest in the coupon collector problem. Compare the experimental results from your program with the mathematical analysis, which says that the expected number of coupons collected before all N values are found should be about N times the Nth Harmonic number (1 + 1/2 + 1/3 + ... + 1/N) and the standard deviation should be about N π / sqrt(6).